This post is the first in our Startup Metrics For Beginners series, introducing different metrics to help you measure your startup’s success.
What is churn rate?
In it’s most simple definition, churn rate is the percentage of customers who cancel their subscription to your product or service within a given time.
A high churn rate indicates that there’s something about your product or service that people either don’t like or weren’t expecting when they signed up. Perhaps something is broken, or you’re not delivering what you promised, or maybe your product is too confusing and your customers just don’t get it.
A high churn rate could indicate any number of problems with your product, website, pricing model, customer support, design, UX… the list goes on. A high churn rate will alert you to the fact that you’re losing customers, but it won’t explain why.
How do I measure churn rate?
The simplest way to calculate churn rate would be divide the number of churns (or cancellations) during a certain period by the number of customers at the beginning of that period.
Unfortunately, its not that simple. Stephen H. Noble explains in this blog post for Shopify…
“The problem here is that the [number of churns over period] value is affected by the entire period but the [number of customers at beginning of period] value is a snapshot from the beginning of the period. This might not have much impact if new customers only make up a small percentage of your user base but for a company that’s growing this can lead to some major misinterpretations.”
To get a more accurate picture of churn in your business, most experts recommend using cohort analysis…
Cohort analysis
A cohort is a group of people who share a common characteristic over a certain period of time and cohort analysis is a way of analysing the behaviours of a particular cohort.
A popular cohort analysis used by many businesses is one that groups customers by the date they signed up for your product. This is particularly useful for measuring churn.
With cohort analysis, instead of measuring just the number of churns each month, you’re measuring churns in relation to when a customer signed up.
Take a look at this example from Christoph Janz, Founding Partner at Point Nine Capital…
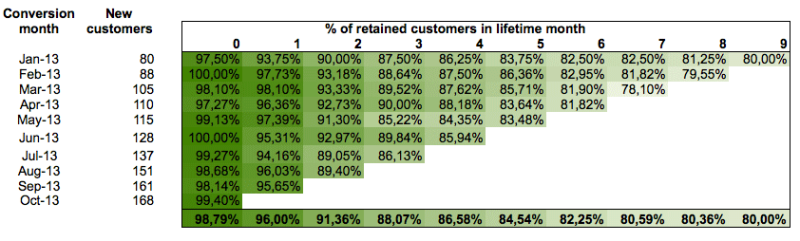
In this cohort analysis, each row relates to the month in which the customers signed up. Each column shows the percentage of customers that were retained each month after they signed up. With this cohort analysis, you can compare the lifetime of customers who signed up in January to the lifetime of customers who signed up in August.
So in this example, you can see how out of all the customers who signed up in January, 93.75% retained their subscription for 1 month. Of all the customers who signed up in August, 96.03% retained their subscription for 1 month. This implies that whatever you’re doing to help customers in the first month of their subscription is working.
Cohort analysis sounds a little daunting but it’s worth getting your head around.
Check out Christopher’s full article on Kissmetrics and this introduction to cohort analysis from RJMetrics for more information.
What should I be aiming for?
In an ideal world, everyone who signs up for your product would stay subscribed forever. In reality, this isn’t going to happen.
It’s been suggested that an “acceptable” churn rate for SaaS companies is between 5-7% annually (check out Lincoln Murphy’s post SaaS Churn Rate – What’s Acceptable, for more information.)
It’s unlikely that you’re going to find a great churn rate in your early days, but as long as you’re measuring, you can work on improving it.
In the early days, expect to see a lot of fluctuation in your churn rate. You should find that, as you learn more about your customers and refine your product and business model, your churn rate should start to steadily decrease. If your churn rate is consistently increasing, it’s time to find out why and make some changes.
How do I improve churn rate?
A high churn rate indicates that your customers aren’t getting what they expected from your product says David Skok, VC at Matrix Partners…
“This much is obvious: if you want to stop your customers from churning, you will need to make them happy with your product/service… Customers bought your product to get a clear business benefit. To make them happy, I believe that you need to make sure they are getting the business benefits they hoped for.”
Reach out to customers and ask for feedback about why they’re leaving. Mark Suster, VC at Upfront Ventures has a few tips…
“Make sure to poll your users to find out why they’re churning. The majority of churn isn’t that your app gets deleted, just not used. If you could message to a subset of these users and ask them why they didn’t use your product you will probably learn a lot. One suggestion I give is to message them with a $5 Starbucks gift card. Many people will give you a small bit of time in exchange for a small gift.”
Take the time to communicate with customers and understand their feedback. Once you start hearing the same complaints 3, 4 or 5 times, you’ll start to get a good idea about what you can do to improve churn.
Conclusion
Churn rate will show you how many people are leaving your product or service on a regular basis. Bear in mind that some churn is normal and be sure to measure accurately using cohort analysis.
Your churn rate will show you how many customers are leaving your product but it won’t tell you why. If you find that your churn is increasing, or has plateaued, its time to dig a little deeper. Communicate with customers who are unsubscribing and find out why. Only then can you start making the changes that will keep your customers happy.